48T
$299.00
96T
$399.00


Species:
Mouse
Alternative Name:
NPPA, ANF, ANP, ATFB6, ATRST2, CDD, CDD-ANF, CDP, PND, Atrial natriuretic peptide, natriuretic peptide A
Uniport ID:
P05125
Assay Type:
Competitive
unit:
pg/mL
Standard:
1000pg/mL
Sensitivity:
9.38 pg/mL
Detection Range:
15.63-1000pg/mL
Assay Time:
1.5H
Sample Type:
Serum, Plasma, Tissue homogenate and Other biological samples;Sample Volume=50μL
Research:
Endocrinology;
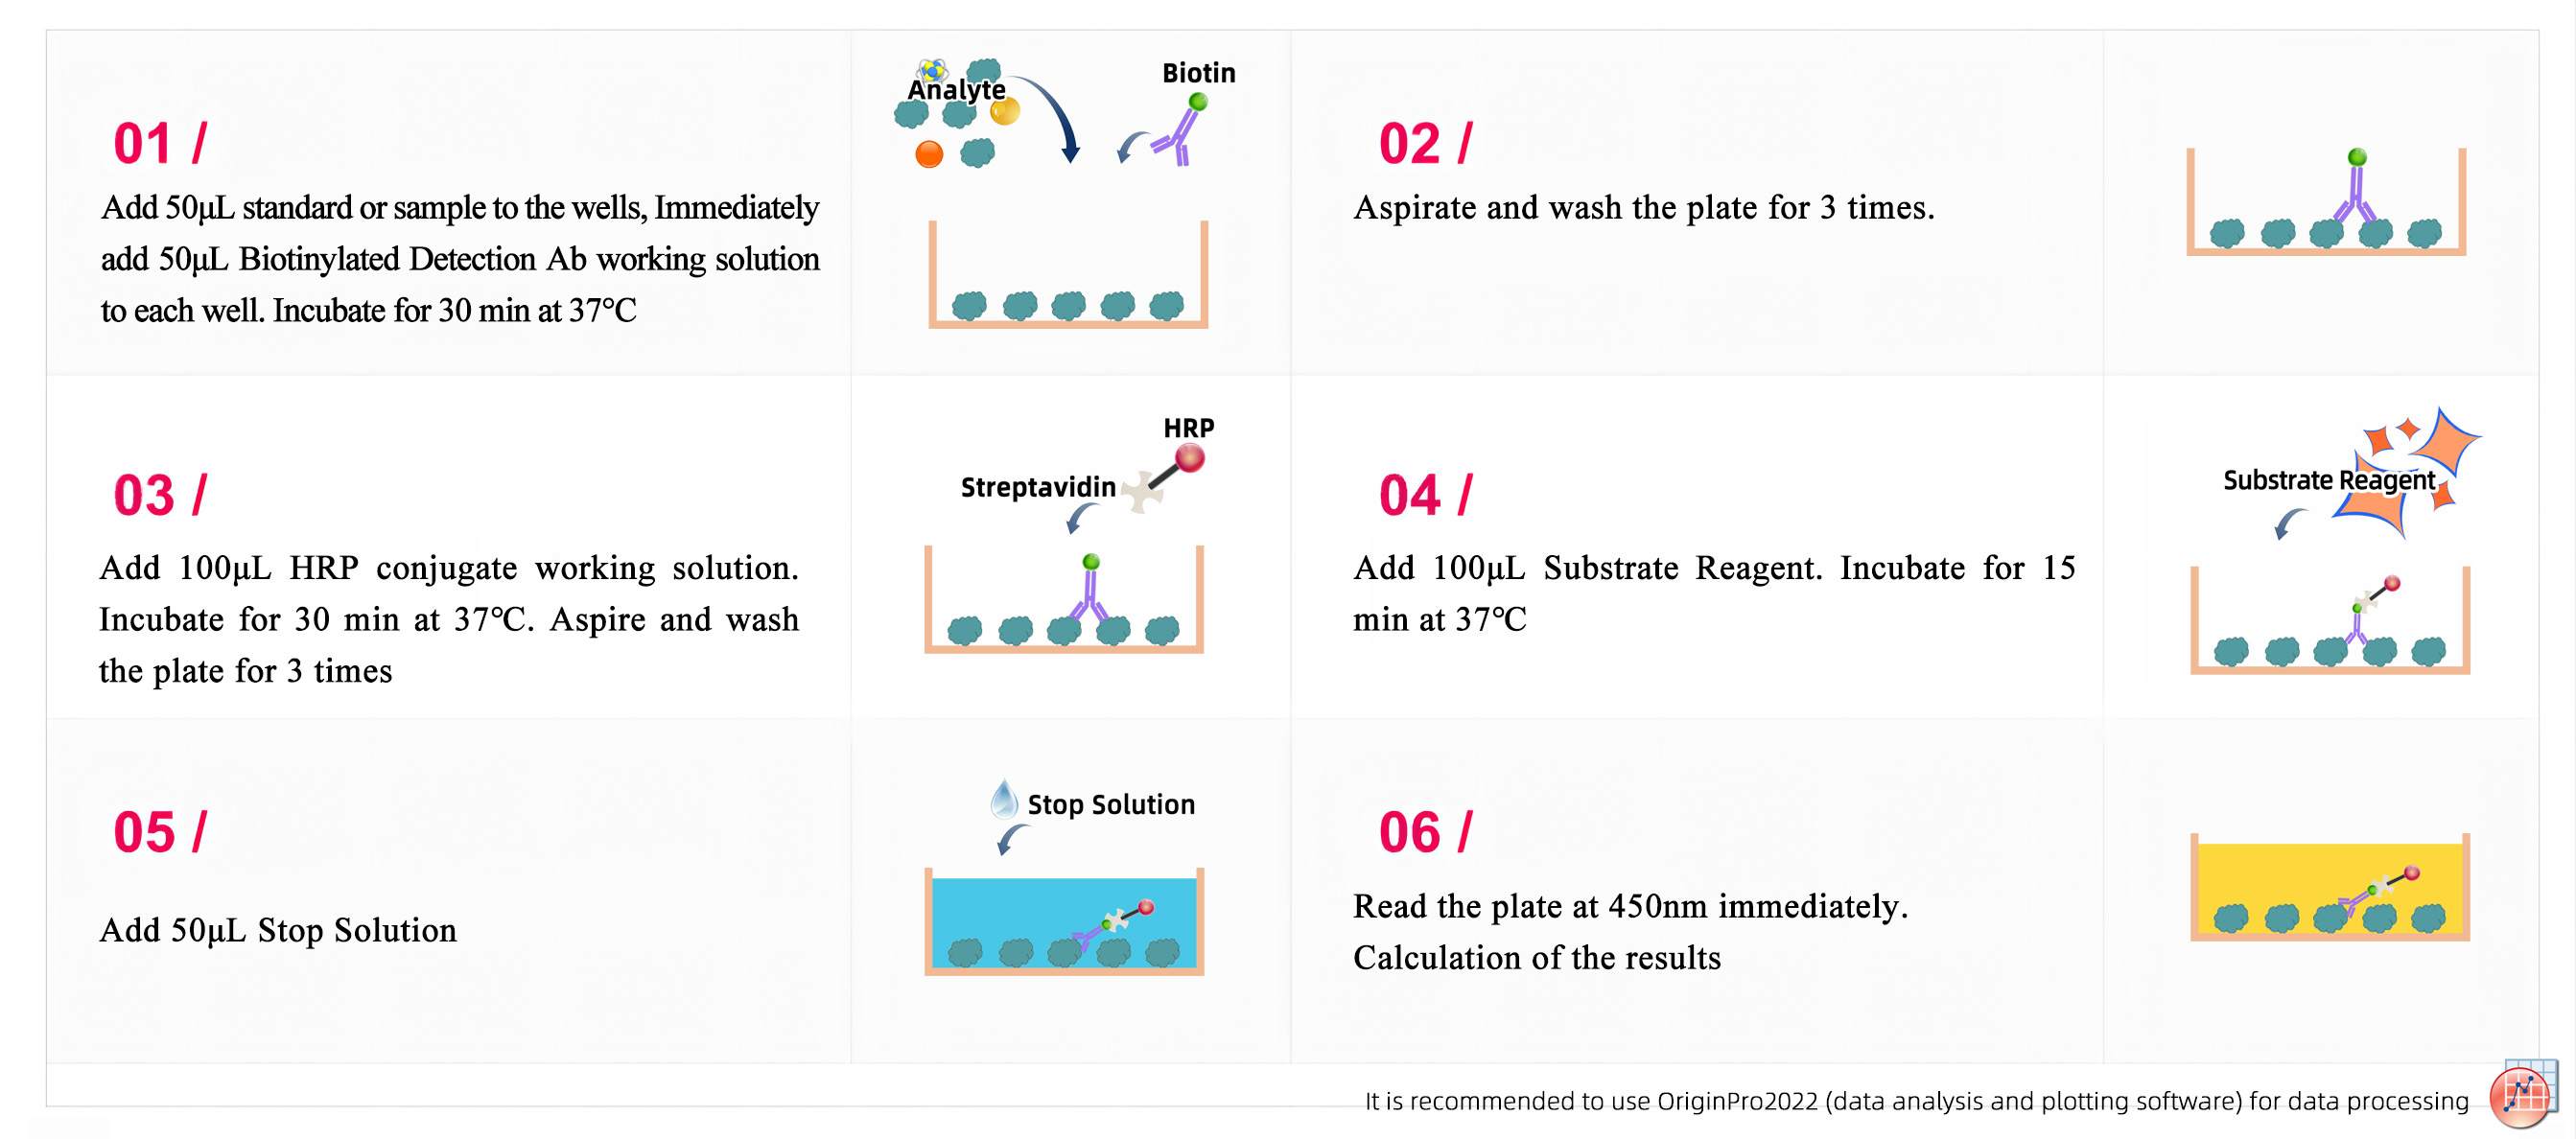
Test Principle:
This ELISA kit uses the Competitive-ELISA principle. The micro ELISA plate provided in this kit has been pre-coated with Mouse ANP. During the reaction, Mouse ANP in the sample or standard competes with a fixed amount of Mouse ANP on the solid phase supporter for sites on the Biotinylated Detection Ab specific to Mouse ANP. Excess conjugate and unbound sample or standard are washed away, and Avidin-Horseradish Peroxidase (HRP) conjugate are added to each micro plate well and incubated. Then a TMB substrate solution is added to each well. The enzyme-substrate reaction is terminated by the addition of stop solution and the color turns from blue to yellow. The optical density (OD) is measured spectrophotometrically at a wavelength of 450 nm ± 2 nm. The concentration of Mouse ANP in tested samples can be calculated by comparing the OD of the samples to the standard curve.
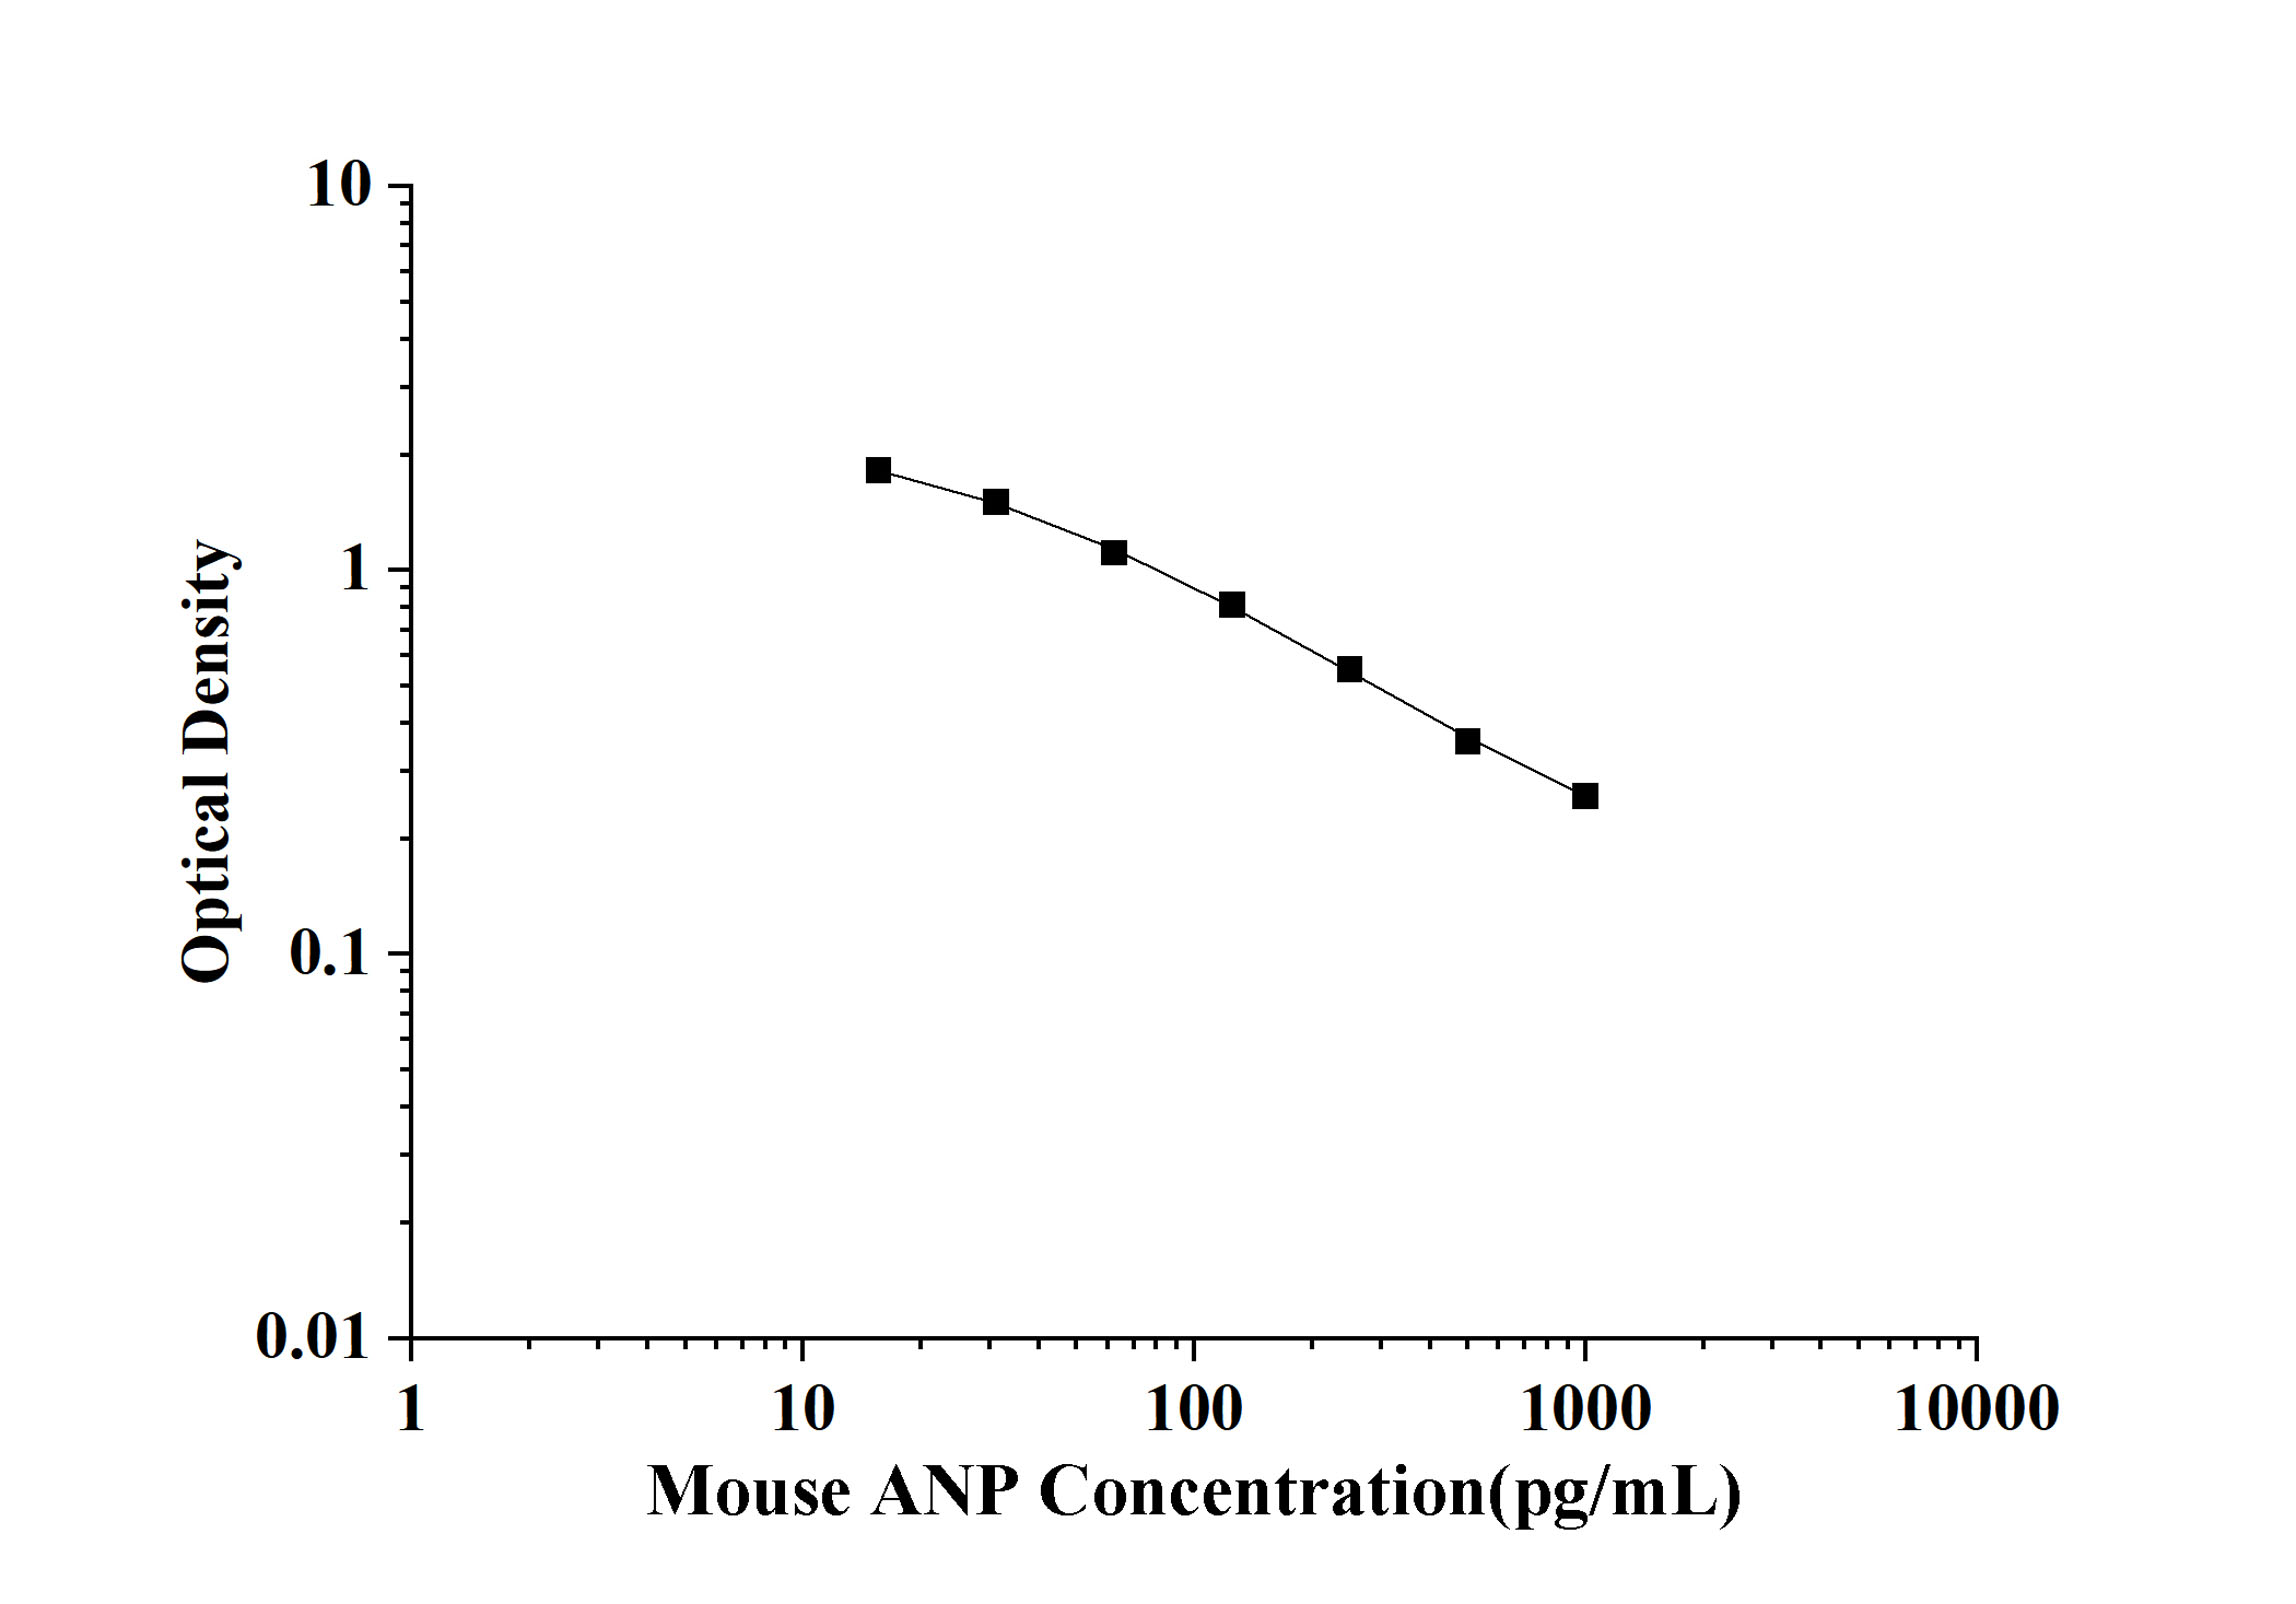
| pg/mL | OD | Corrected |
|---|---|---|
| 1000 | 0.291 | |
| 500 | 0.391 | |
| 250 | 0.585 | |
| 125 | 0.846 | |
| 62.5 | 1.141 | |
| 31.25 | 1.536 | |
| 15.63 | 1.85 | |
| 0 | 2.514 |
Intra-assay Precision (Precision within an assay): 3 samples with low, mid range and high level were tested 20 times on one plate, respectively.
Inter-assay Precision (Precision between assays): 3 samples with low, mid range and high level were tested on 3 different plates, 20 replicates in each plate, respectively.
| Intra-assay Precision | Inter-assay Precision | |||||
|---|---|---|---|---|---|---|
| Sample | 1 | 2 | 3 | 1 | 2 | 3 |
| n | 20 | 20 | 20 | 20 | 20 | 20 |
| Mean(ng/mL) | 0.74 | 207.47 | 384.61 | 26.15 | 255.37 | 409.35 |
| Standard deviation | 2.42 | 9.9 | 15.92 | 1.03 | 9.56 | 16.54 |
| C V (%) | 6.58 | 4.14 | 3.15 | 6.23 | 7.29 | 5.23 |
| Sample Type | Range(%) | Average Recovery(%) |
|---|---|---|
| Serum (n=8) | 83-96 | 89 |
| EDTA plasma (n=8) | 92-107 | 99 |
| Cell culture media (n=8) | 92-105 | 98 |
| Serum (n=5) | EDTA plasma (n=5) | Cell culture media (n=5) | ||
|---|---|---|---|---|
| 1:2 | Range (%) | 86-97 | 82-96 | 89-97 |
| Average (%) | 88 | 86 | 96 | |
| 1:4 | Range (%) | 93-102 | 82-96 | 85-101 |
| Average (%) | 98 | 83 | 98 | |
| 1:8 | Range (%) | 87-98 | 85-96 | 84-98 |
| Average (%) | 91 | 92 | 91 | |
| 1:16 | Range (%) | 83-97 | 87-101 | 85-93 |
| Average (%) | 90 | 100 | 90 |